Image-based Meshing
scikit-shape can be used to triangulate regions of a given image. This kind
of a triangulation is useful for finite element simulations of physics, such as
elasticity or heat transfer, to understand how the object represented by
the image would behave with respect to such physics. There are two ways
a triangulation can be obtained for the given image:
As a by-product of segmentation: The curve evolution approach to segmentation
produces a final set of curves defining the boundaries of the regions in the
image. These curves, stored in a skshape.geometry.curve.CurveFamily,
can be used to create a skshape.geometry.curve.Domain2d object,
which encapsulates a triangulation.
By triangulation a segmentation: A labeled image, representing segmentation
can be passed to triangulate_from_labels() function in
skshape.geometry.curve_network. This function will return a list
of the boundary curve pieces and the triangulation matching the labeled regions
of the image.
Both options rely on installation of the :mod:’triangle’ package, which is a Python encapsulation of the C code Triangle by J. Shewchuk.
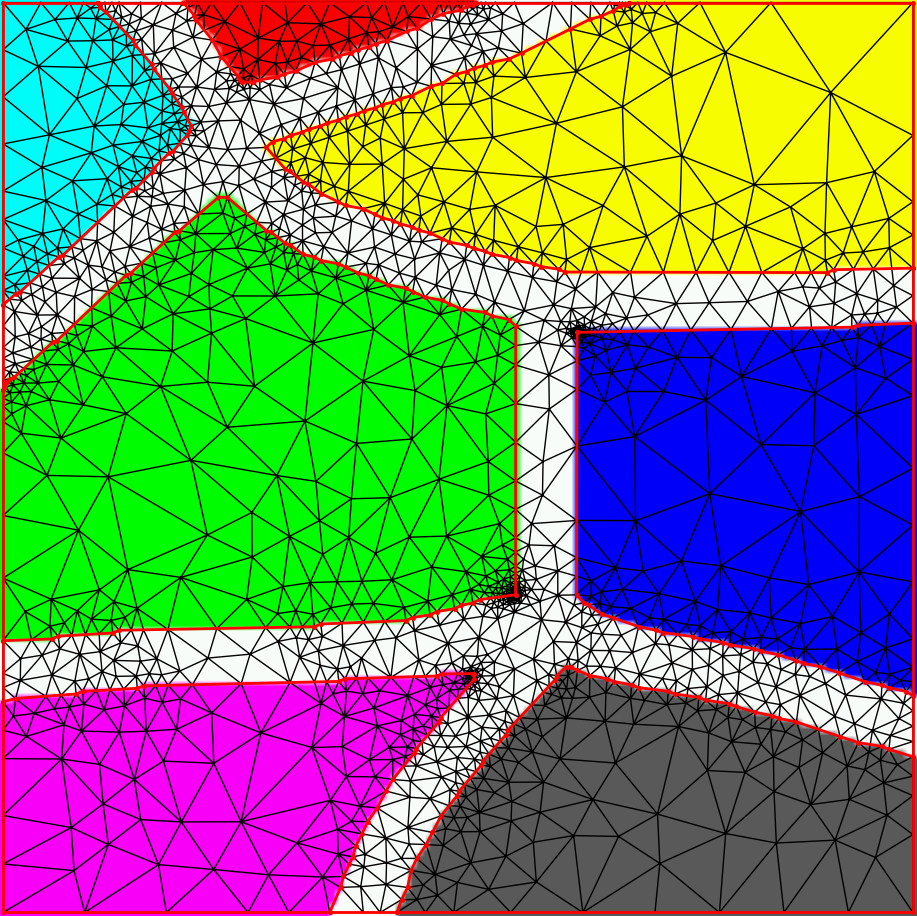
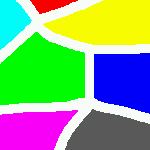
In the following, we give an example of the second option, and show how a region-conforming triangulation can be obtained by using a segmented image as input. The segmented image is a 2d label array, in which pixel is labeled by id number, an integer or float, representing the region including the pixel. For the sake of this example, we use an image that is already segmented by color.
We load the example color image, and turn into a grayscale label image using the rgb2gray function from scikit-image
>>> import matplotlib.pyplot as plt
>>> from skimage.color import rgb2gray
>>> from skshape.geometry.curve_network import triangulation_from_labels
>>> image = plt.imread('data/labeled_regions.png')
>>> label_image = rgb2gray(image)
We pass the label image to the function triangulation_from_labels(),
returns the vertex coordinates of the triangulation in vertices, and
a list of triangle vertex triplets in triangles.
>>> curves, vertices, triangles = triangulation_from_labels( label_image )
We can now plot the triangles overlayed with the image. To do this, we need to correct the scale of the triangle vertex coordinates, which were normalized assuming a unit square coordinate domain. We need to multiply them by a scale factor to map them back to the pixel coordinates.
>>> scale = min(image.shape[:2]) - 1.0
>>> x,y = scale*vertices[:,1], scale*vertices[:,0]
>>> plt.figure();  plt.imshow(image)
>>> plt.triplot( x, y, triangles=triangles.T, color='k' )
>>> plt.axis('image');  plt.show()