
Image Segmentation
Image Segmentation is the task of identifying objects or regions in a given image. One way to achieve this is a to create label arrays, in which the label of a pixel denotes which region the pixel belongs to. Scikit-shape includes different algorithms to compute label arrays from input images. Another approach is to use deformable boundary curves to delineate boundaries of regions in images.
Curve objects in scikit-shape can be used to realize a deformable boundary segmentation algorithm by shape optimization of segmentation energies, such as GeodesicActiveContourEnergy or ChanVeseEnergy. This approach builds on explicit Lagrangian curve representations in Curve and CurveFamily. An alternative approach is to use an implicit Eulerian representation, such as a level set function or a phase field function. This has higher computational cost, but is more flexible for representing diverse topologies of regions. In the following, we demonstrate an example of phase field segmentation.
Phase field segmentation
Segmentation by topology optimization
In this example, we use the region-regularized topology optimization algorithm to segment color images into distinct regions, such that the image intensity in each region can be modeled with a Laplacian distribution.
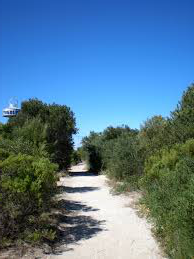
We start by importing the plotting and segmentation functions. Then we load the example image, a color image of a natural scene, with a road, trees and sky.
>>> import matplotlib.pyplot as plt
>>> from skshape.image.segmentation import segment_by_topology
>>> image = plt.imread('data/bush.png')[:,:,0:3]
Now we can segment the image using the topology optimization algorithm for image regions.
>>> label, new_image = segment_by_topology( image, n_phases=4, model='Laplace', mu=30, sigma=6, init_method='zero', gamma=0.5, epsilon=0 )

>>> plt.figure()
>>> plt.subplot(1,3,1);  plt.imshow(image)
>>> plt.axis('off');  plt.title('Original image')
>>> plt.subplot(1,3,2);  plt.imshow(label)
>>> plt.axis('off');  plt.title('Segmentation')
>>> plt.subplot(1,3,3);  plt.imshow(new_image)
>>> plt.axis('off');  plt.title('Assigned colors')
>>> plt.show()